Compound InterestHow interest earns its own interest
Compound interest is interest calculated on both the original starting balance and the interest already accumulated from past periods. Because each payout increases the total balance, future gains are calculated on a larger pile of money. Over long horizons, this cycle allows earned interest to eventually outgrow the amount originally put in.
By the edgi team We find the most surprising true thing about an idea and build a 60-second lesson around it.
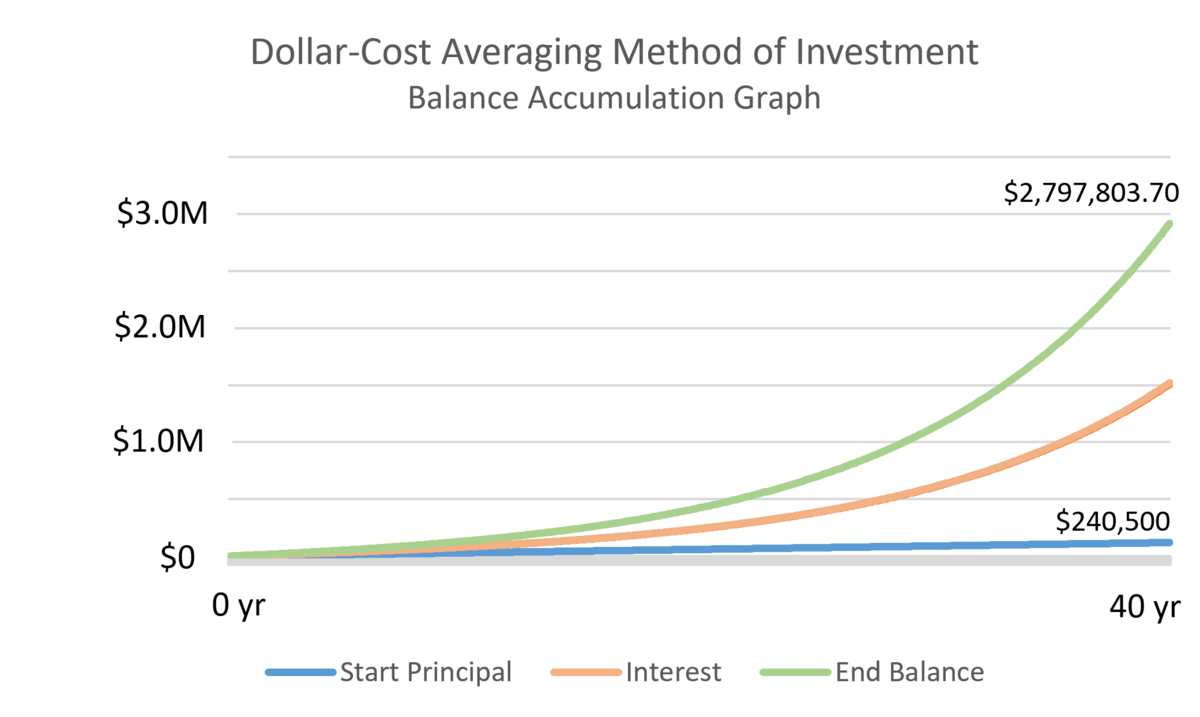
$300 a month for 40 years is $144,000 out of your account, roughly ten dollars a day. The other $643,000 in that balance is what the money earned while it sat there. That balance assumes the money earns 7% a year. US stocks have averaged nearly 10% before inflation since 1926, and decades landed far above and far below that, so 7% is the cautious planning number.
A "Dollar-Cost Averaging Method of Investment Balance Accumulation Graph" plots investment growth over 40 years. CC BY-SA 4.0, via Wikimedia Commons
Compound interest is why the earnings get that large. Each year's growth is added to the balance, and the next year's growth is worked out on the bigger number, so the returns start earning returns. Nothing on your side changes. The $300 stays $300. What keeps growing is the pile it lands on, so every year's gain is larger than the one before it.
Ten years off the front
Ten years of delay costs more than ten years of payments. $300 a month at 7% for 30 years ends near $366,000; the same payment for 40 years ends near $787,000. Those ten missing years are only $36,000 of contributions. Leaving them out costs about $421,000, which is more than the entire 30-year balance.
The earliest money has the longest time to multiply, so it does the most work. Pay that same $36,000 in over the final ten years instead and it reaches about $52,000. Same money, same account, eight times the money at the end. The only thing that changed is which decade it went in.
How often money doubles
At 7% a year, a balance left alone doubles about every ten years. The Rule of 72 is where that comes from: divide 72 by the rate and you get the doubling time. 72 divided by 7 gives 10.3 years, against a true answer of 10.2. The shortcut stays that close between about 6 and 10 percent, and drifts outside that range.
Doubling is also why the end of a long run looks lopsided. A balance takes the same ten years to go from $25,000 to $50,000 as it later takes to go from $200,000 to $400,000. The biggest single jump is always the last one. The only way to get it is to have spent the earlier decades working through the small ones.
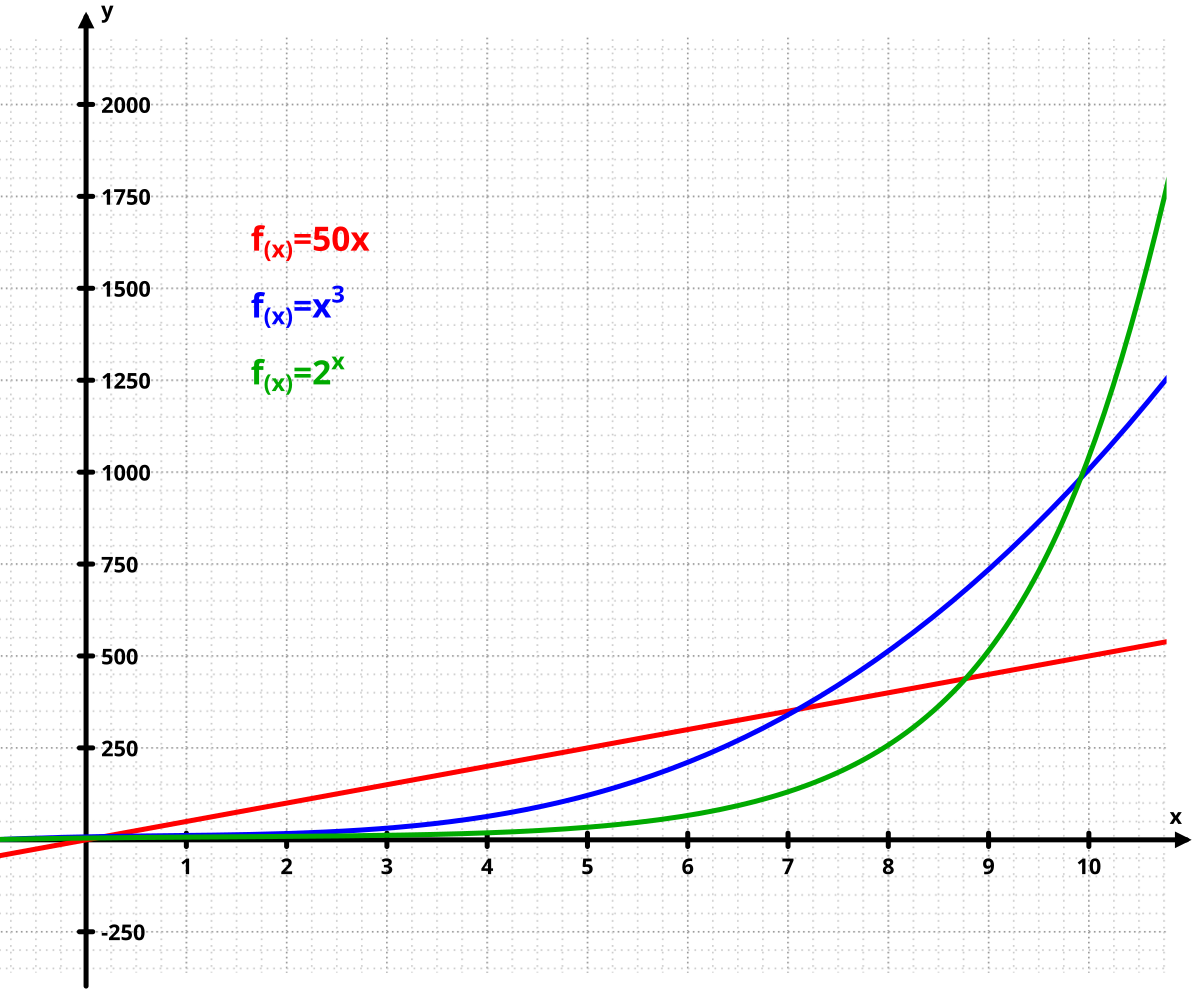
Graph plotting three functions: f(x)=50x (red, linear), f(x)=x^3 (blue, cubic), and f(x)=2^x (green, exponential). Exponential.png: Lunkwill / derivative work: McSush, Public domain, via Wikimedia Commons
How compounding frequency changes the total return
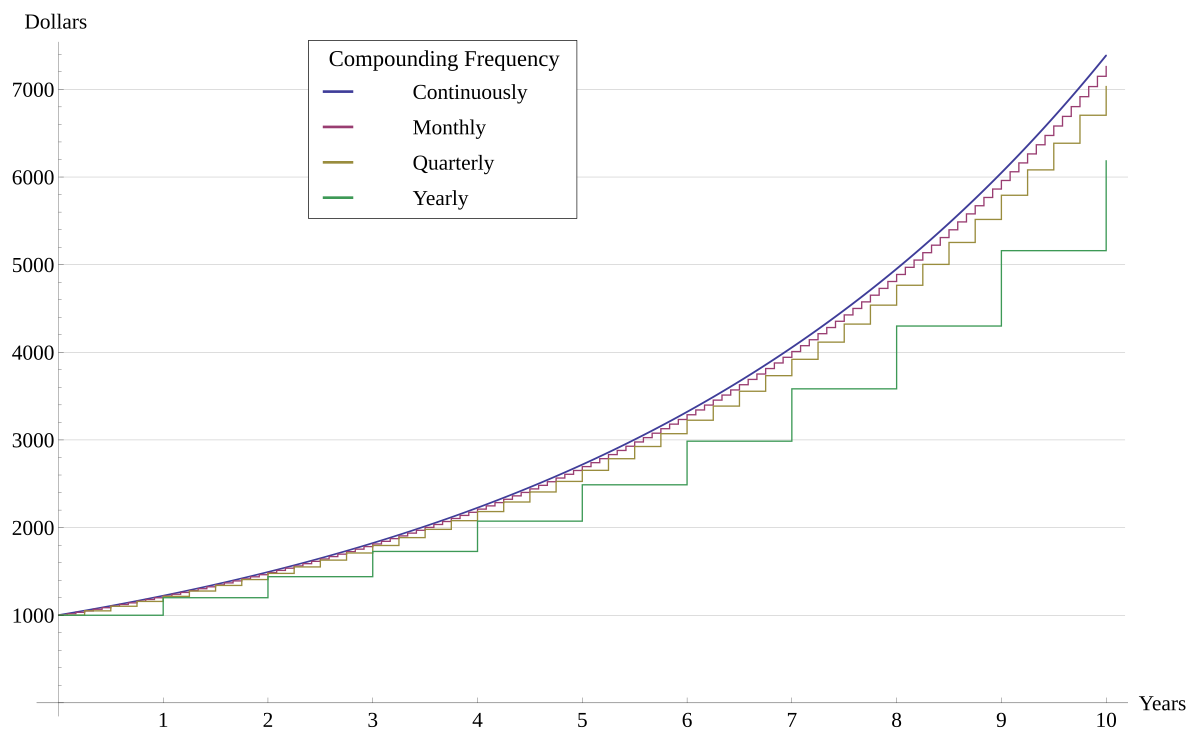
Compounding frequency is the number of times per year that accumulated interest is capitalized, meaning added directly to the principal balance. This schedule can be yearly, half-yearly, quarterly, monthly, weekly, daily, or continuous.
Compare the growth curves across different compounding intervals to see how higher frequencies produce larger balances from the same starting sum. Jelson25, CC BY-SA 3.0, via Wikimedia Commons
A higher compounding frequency yields a higher total return because interest begins generating its own gains sooner. To help consumers compare products with different schedules, financial institutions publish standardized figures like the annual equivalent rate or effective annual percentage rate, which measure the full interest accumulated over one year divided by the starting principal.
From Roman usury laws to Bernoulli's constant
A Babylonian clay tablet from roughly 2000 to 1700 B.C. provides what may be the earliest surviving record of a compound interest problem. Despite its ancient pedigree, charging compound interest on loans was long condemned as the worst form of usury under Roman law and common law traditions across many countries.
Formal mathematical analysis of compounding developed in Europe centuries later. Luca Pacioli published the Rule of 72 in 1494, and Richard Witt published the first book dedicated entirely to compound interest in 1613, providing 124 worked examples and rate tables. In 1683, mathematician Jacob Bernoulli discovered the mathematical constant e while studying questions about continuous compounding.
Where compound interest appears in modern finance
Not all modern loans use compound interest. U.S. mortgages rely on an amortizing loan structure where interest is paid off each month rather than added to the principal balance. In contrast, Canadian mortgages compound semi-annually with monthly or more frequent payments.
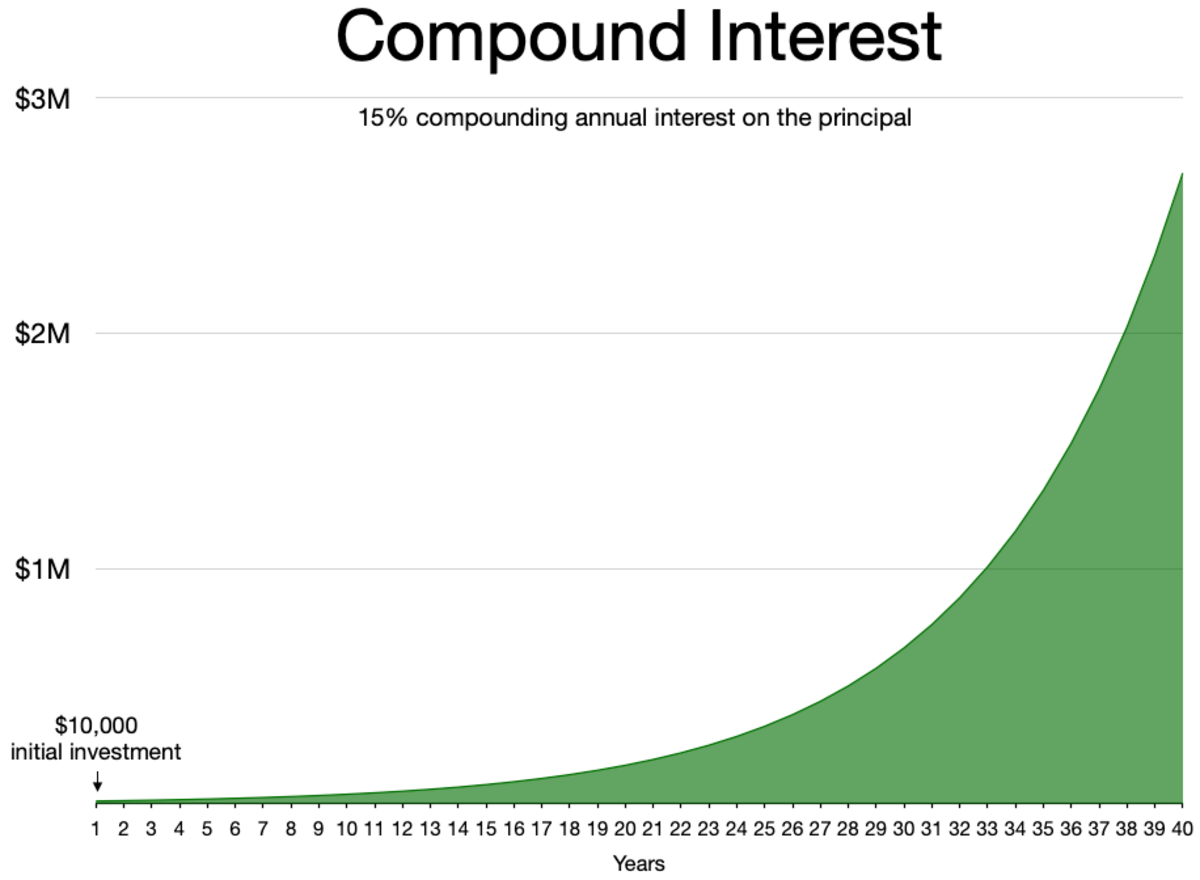
Track the steep upward curve over four decades to see how reinvested returns accelerate total asset value. Wikideas1, CC0, via Wikimedia Commons
Corporate and government bonds typically pay interest twice yearly, producing an effective annual return higher than the nominal stated rate. In financial mathematics, derivatives pricing relies on continuous compounding, which models interest calculated at ever-increasing frequencies until it approaches continuous time.
Test yourself
What makes compound interest accelerate so dramatically over long time horizons?
Returns earn returns on a growing base. Compound interest accelerates because the accumulated gains are added to the principal, meaning each new percentage gain is calculated on a larger total.
Why does delaying investments by ten years early cost far more than missing ten years at the end?
Early money gets the most doubling cycles. Money invested early undergoes multiple doubling periods. Missing the front end removes the very cycles that generate the largest absolute gains at the finish.
Does the first decade of contributions do more work than the last decade?
Yes, it has the most years to multiply. The same $36,000 paid in during the first ten years reaches about $421,000 after 40 years. Paid in during the last ten, it reaches about $52,000.
Play the lesson in edgi and the card is yours. It lands on your Map next to the ideas it connects to, and turns from matte to foil to gold as you learn more around it.
What is the difference between simple interest and compound interest?
Simple interest calculates gains strictly on the original principal for every period. Compound interest adds previously earned interest to that principal, meaning subsequent interest calculations apply to a progressively larger balance.
What was compound interest called historically?
In older legal and mathematical texts, compound interest was commonly referred to as anatocism.