Volatility: why swings grow with the square root of time
Volatility is a statistical measurement of how much an asset's price swings over time, calculated as the standard deviation of its returns. It does not measure whether an investment makes or loses money, but how widely its prices scatter around the average. In a simple random-walk model, fluctuations partly cancel out, so the spread of possible prices grows with the square root of time rather than in a straight line.
By the edgi team We find the most surprising true thing about an idea and build a 60-second lesson around it.
Most people think volatility means losing money, but that is wrong. It simply measures how fast and how far a price is moving. Think of it as the width of the road a stock is driving on. High volatility means a very wide, bumpy road where the car swerves constantly.
An aerial view of the Old Tremola Road, a winding serpentine road traversing a mountainous landscape in Switzerland. Patryk Hejduk, CC BY-SA 4.0, via Wikimedia Commons
Mathematically, this is usually measured using standard deviation, which captures the dispersion of returns over time.
Trading uncertainty
In 1973, Fischer Black and Myron Scholes changed finance with the Black–Scholes model, which finally cracked the code on how to price a stock option. They realized the most important variable was not the stock's current price, but the market's expectation of future chaos: implied volatility.
Portrait of Myron Scholes in 2008, wearing glasses, a patterned gold tie, and a blue lanyard. The original uploader was Nobellaureatesphotographer at English Wikipedia., CC BY-SA 3.0, via Wikimedia Commons
By working backward from option prices, they turned pure uncertainty into a hard number that could be bought and sold.
The feedback loop
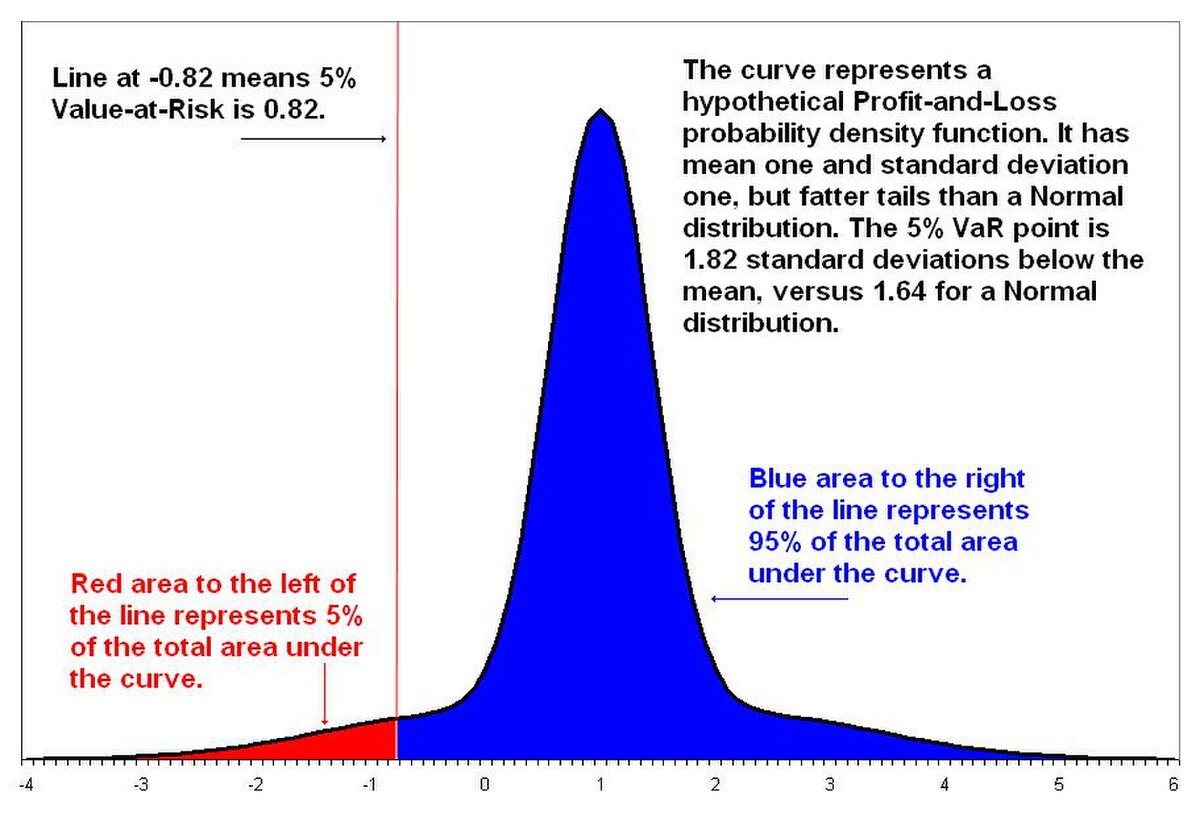
Banks use this math to calculate their Value at risk, a way to quantify how much they stand to lose in a bad scenario. But volatility is also a self-fulfilling prophecy.
Diagram illustrating the 5% Value at Risk (VaR) of a hypothetical profit-and-loss probability density function. Original uploaded by AaCBrown (Transfered by Matanya), Public domain, via Wikimedia Commons
When it spikes, automated trading systems often sell to limit risk, which causes the price to swing even wider, creating even more volatility.
How volatility is calculated
In mathematics, volatility is represented by the Greek letter sigma (σ) and calculated as the standard deviation of logarithmic returns. For a process following a random walk, the range of potential prices widens as time passes, but it increases with the square root of time. Twice as much time does not mean twice the price deviation.
Traders often annualize daily volatility by multiplying daily standard deviation by the square root of the number of trading days in a year, typically set at 252. If an asset has a daily volatility of 0.01, its annualized volatility is 0.01 multiplied by the square root of 252, giving roughly 0.1587 or 15.87 percent. Real price changes don't follow a Gaussian distribution, though. Benoît Mandelbrot found that cotton prices followed a Lévy alpha-stable distribution, which has fatter tails and scales differently over time.
Historic versus implied volatility
Finance separates volatility into two perspectives: backward-looking and forward-looking. Historic volatility calculates actual price dispersion from past market data, such as a rolling 30-day or 90-day window. Realized volatility is calculated using the square root of realized variance, summing squared returns across the observations.
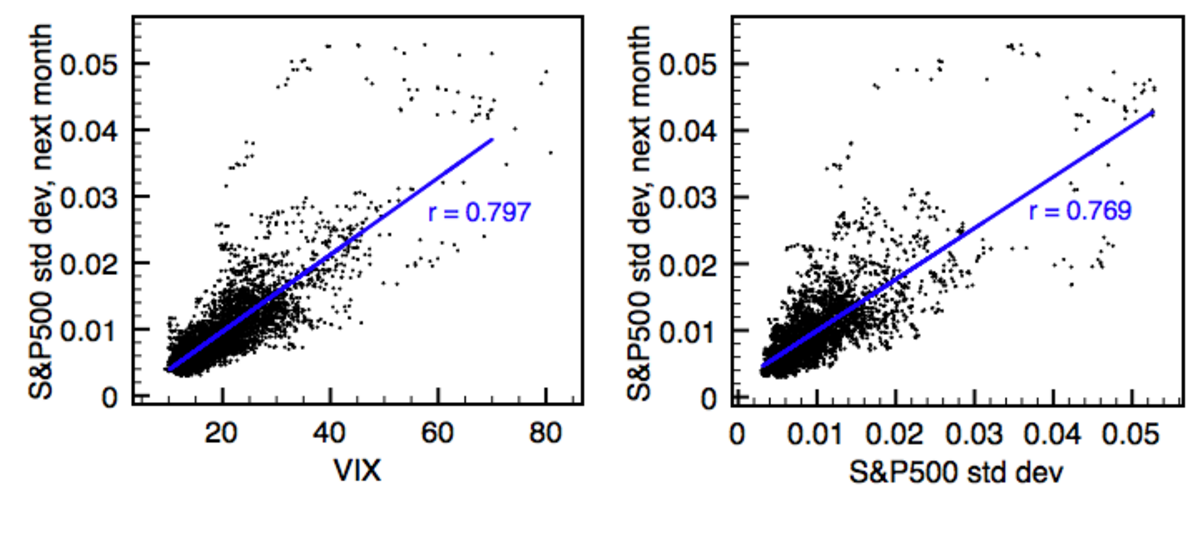
A comparison showing how well implied volatility indices predict future price swings over a 30-day window compared to historical data. Artur adib, Public domain, via Wikimedia Commons
Implied volatility looks forward. It is not calculated from historical price movements, but is extracted backward from the current market prices of traded options using pricing formulas like the Black–Scholes model. It reflects the market's current expectation of future price swings up until the option's expiration date.
Test yourself
A stock's volatility rises. What can you infer from that alone?
Its price changes may become larger. Higher volatility means returns vary more; it does not reveal whether the stock will rise or fall.
In finance, what does volatility measure?
How widely returns vary over time. Volatility measures the spread of price changes, not their direction. A highly volatile asset can rise or fall sharply.
In finance, what does volatility measure?
How widely returns vary over time. Volatility measures the spread of price changes, not their direction. A highly volatile asset can rise or fall sharply.
Play the lesson in edgi and the card is yours. It lands on your Map next to the ideas it connects to, and turns from matte to foil to gold as you learn more around it.
What is the difference between historic volatility and realized volatility?
Historic volatility tracks past prices over a specified window. Realized volatility is nearly synonymous, calculated specifically as the square root of realized variance, which divides the sum of squared returns by the number of observations.
Why is the square root of 252 used in volatility formulas?
A common assumption is 252 trading days in a year. Because in a random-walk model fluctuations scale with the square root of time, daily volatility is multiplied by the square root of 252 to convert it to an annualized figure.