The impossible math
Market timing means trying to predict the exact peaks and valleys of stocks. To pull it off successfully, an investor has to make two flawless decisions: when to sell, and when to buy back in.
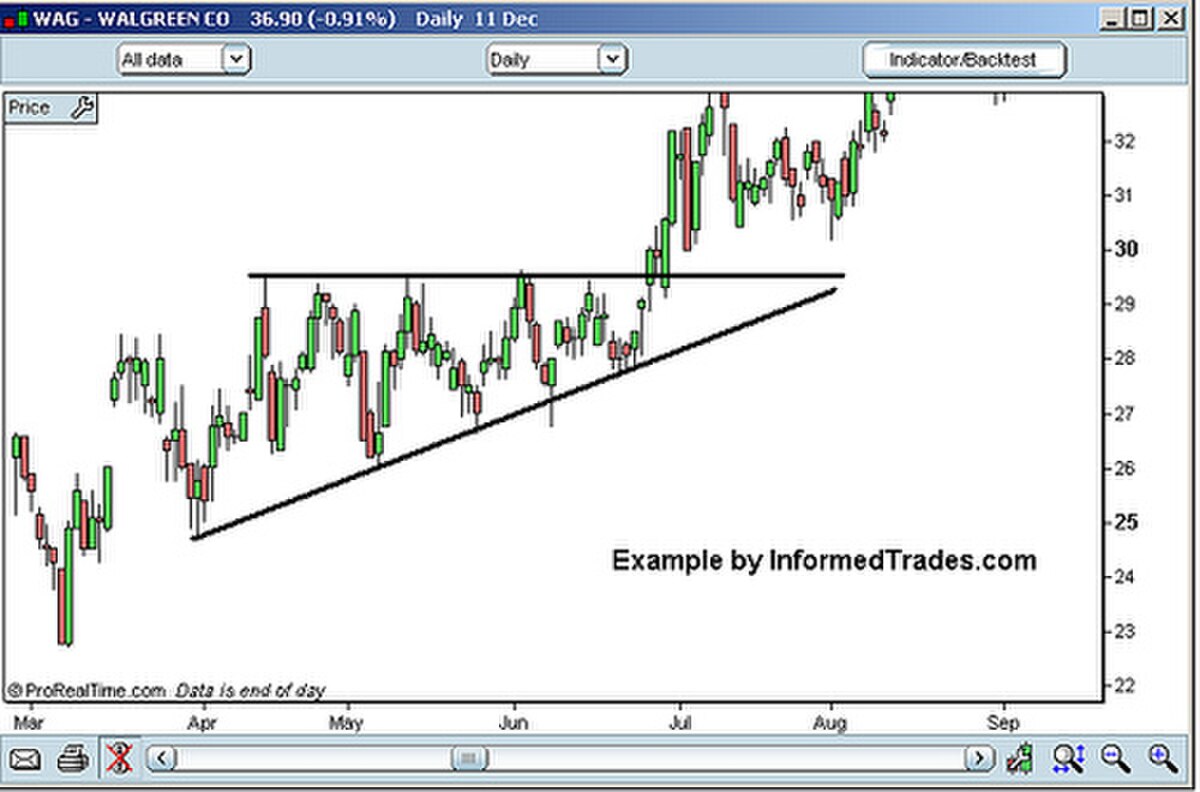
Market timing is an investment strategy where you buy or sell assets by trying to predict future market price movements. It relies on an outlook for the entire market rather than a single company. Because short-term market returns are almost unpredictable, trying to time turns often causes investors to buy near peaks and sell near bottoms.

By the edgi team We find the most surprising true thing about an idea and build a 60-second lesson around it.
Market timing means trying to predict the exact peaks and valleys of stocks. To pull it off successfully, an investor has to make two flawless decisions: when to sell, and when to buy back in.
Studies of long-term stock returns show a surprising pattern. The market's biggest gains often happen immediately after its steepest drops, during periods of panic.
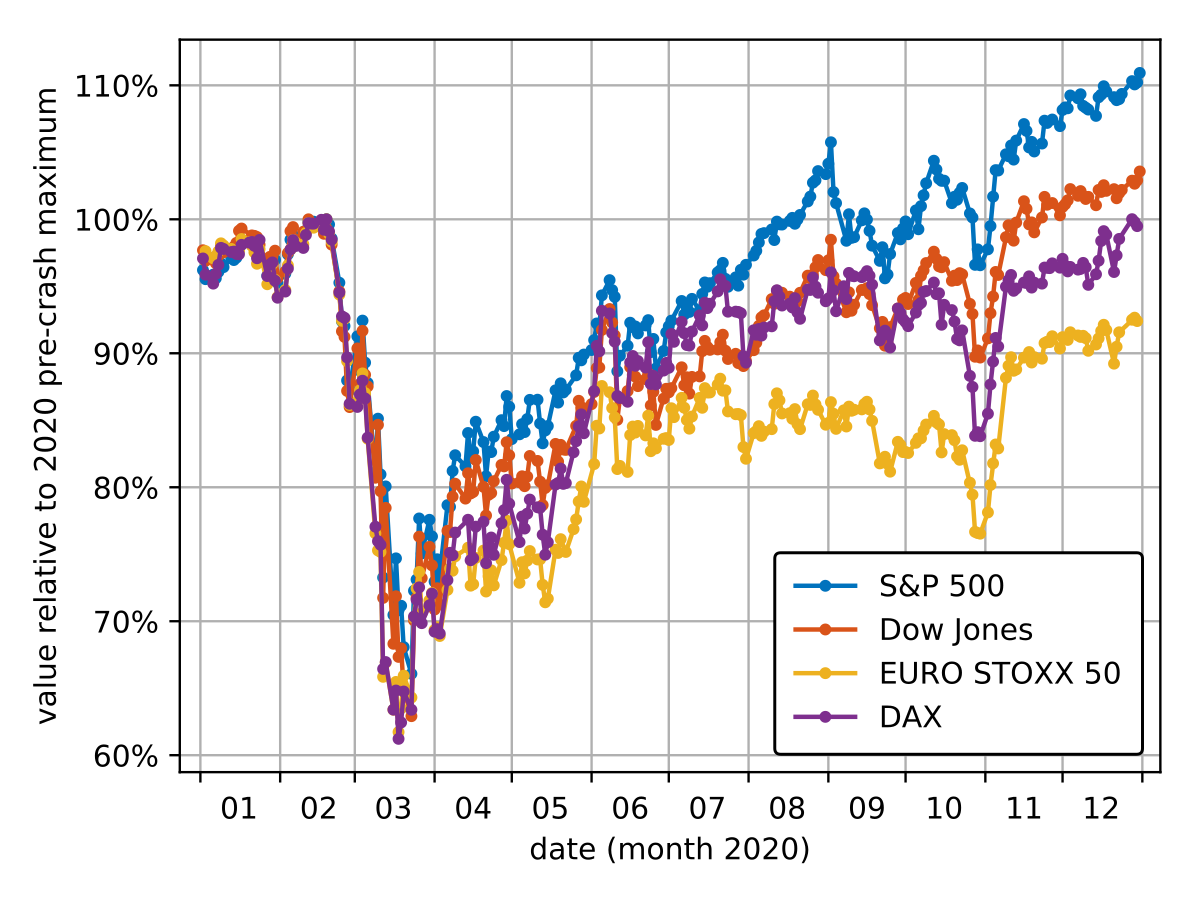
If you sit on the sidelines waiting for safety, you frequently miss the explosive rebounds that drive all the growth.
Because guessing the turning point is so difficult, most professional investors fail to time the market over long horizons. This gave rise to the buy-and-hold strategy, where investors ride out the drops rather than trying to dodge them.
Mutual fund flow data shows that individual investors tend to chase past performance. They buy funds after prices rise and sell after prices drop. Senior Economist YiLi Chien at the Federal Reserve Bank of St. Louis noted a positive correlation coefficient of 0.49 between mutual fund inflows and past returns.
This return-chasing behavior backfires because stock market returns tend to revert to their long-term average. In early 2000, stock mutual funds saw their largest inflows near the start of a major bear market. In mid-2002, the largest fund outflows came near the start of a bull market.
Over the 20-year period ending in 2008, the inflation-adjusted S&P 500 return averaged about 5.3% annually. An S&P 500 index fund turned $1 million into $2.7 million after costs over that stretch, while the average investor turned $1 million into about $800,000.
Many market timers use technical indicators like the 50-day and 200-day moving averages to guide their trades. Crossing above these averages is viewed as bullish, while crossing below is seen as bearish. Institutional investors often use proprietary market-timing software, and some published algorithms try to predict when stocks will outperform bonds.
A major pitfall in developing these trading systems is curve fitting. Trading rules often become over-optimized to match historical back-tested datasets and subsequently fail when applied to real future market data. Even when developers test algorithms on out-of-sample data, revising the strategy to fit those results removes the out-of-sample protection.
Market timing: an investor sells during a downturn and waits for calm. What risk follows?
They may miss a sharp rebound before buying back. The strongest up days can arrive soon after steep drops, while the investor is still waiting to return.
Market timing: why must an investor predict both an exit and a reentry?
Missing rebounds after selling can erase gains. Market timing depends on both decisions, and the strongest gains can follow sharp drops. Waiting for safety may mean missing those rebounds.
Market timing means choosing when to buy or sell based on what?
Predictions of future price movements. Market timing uses forecasts of future price movements to decide when to trade, unlike scheduled investing or periodic rebalancing.
Collectible card
Play the lesson in edgi and the card is yours. It lands on your Map next to the ideas it connects to, and turns from matte to foil to gold as you learn more around it.
The efficient-market hypothesis is the assumption that asset prices reflect all available information. Under this theory, it is theoretically impossible to systematically beat the overall market through predictive trading.
Research by Dalbar shows that the average retention rate for stock and bond funds is three years. This means an investor switches funds roughly seven times over a 20-year period.
Part of the Set · 8 cards
Wall Street's geniuses, on average, lose to a fund that buys everything and sleeps.
Lesson complete
You finished the lesson. In edgi, the card goes on your Map next to everything else you learn.