Forgetting curveWhy most memory loss happens on day one
The forgetting curve is a mathematical model showing how quickly people lose newly learned information over time when they make no effort to retain it. Most of the drop occurs immediately, often cutting retention drastically within the first day. After that sharp initial decline, the rate of memory loss slows down significantly.
By the edgi team We find the most surprising true thing about an idea and build a 60-second lesson around it.
You sat through the whole lecture and it made sense at the time. The next morning you can name the topic and maybe two examples, and the rest will not come. The odd part is the timing. A week later you will have lost a little more, but far less than you lost in that first day.
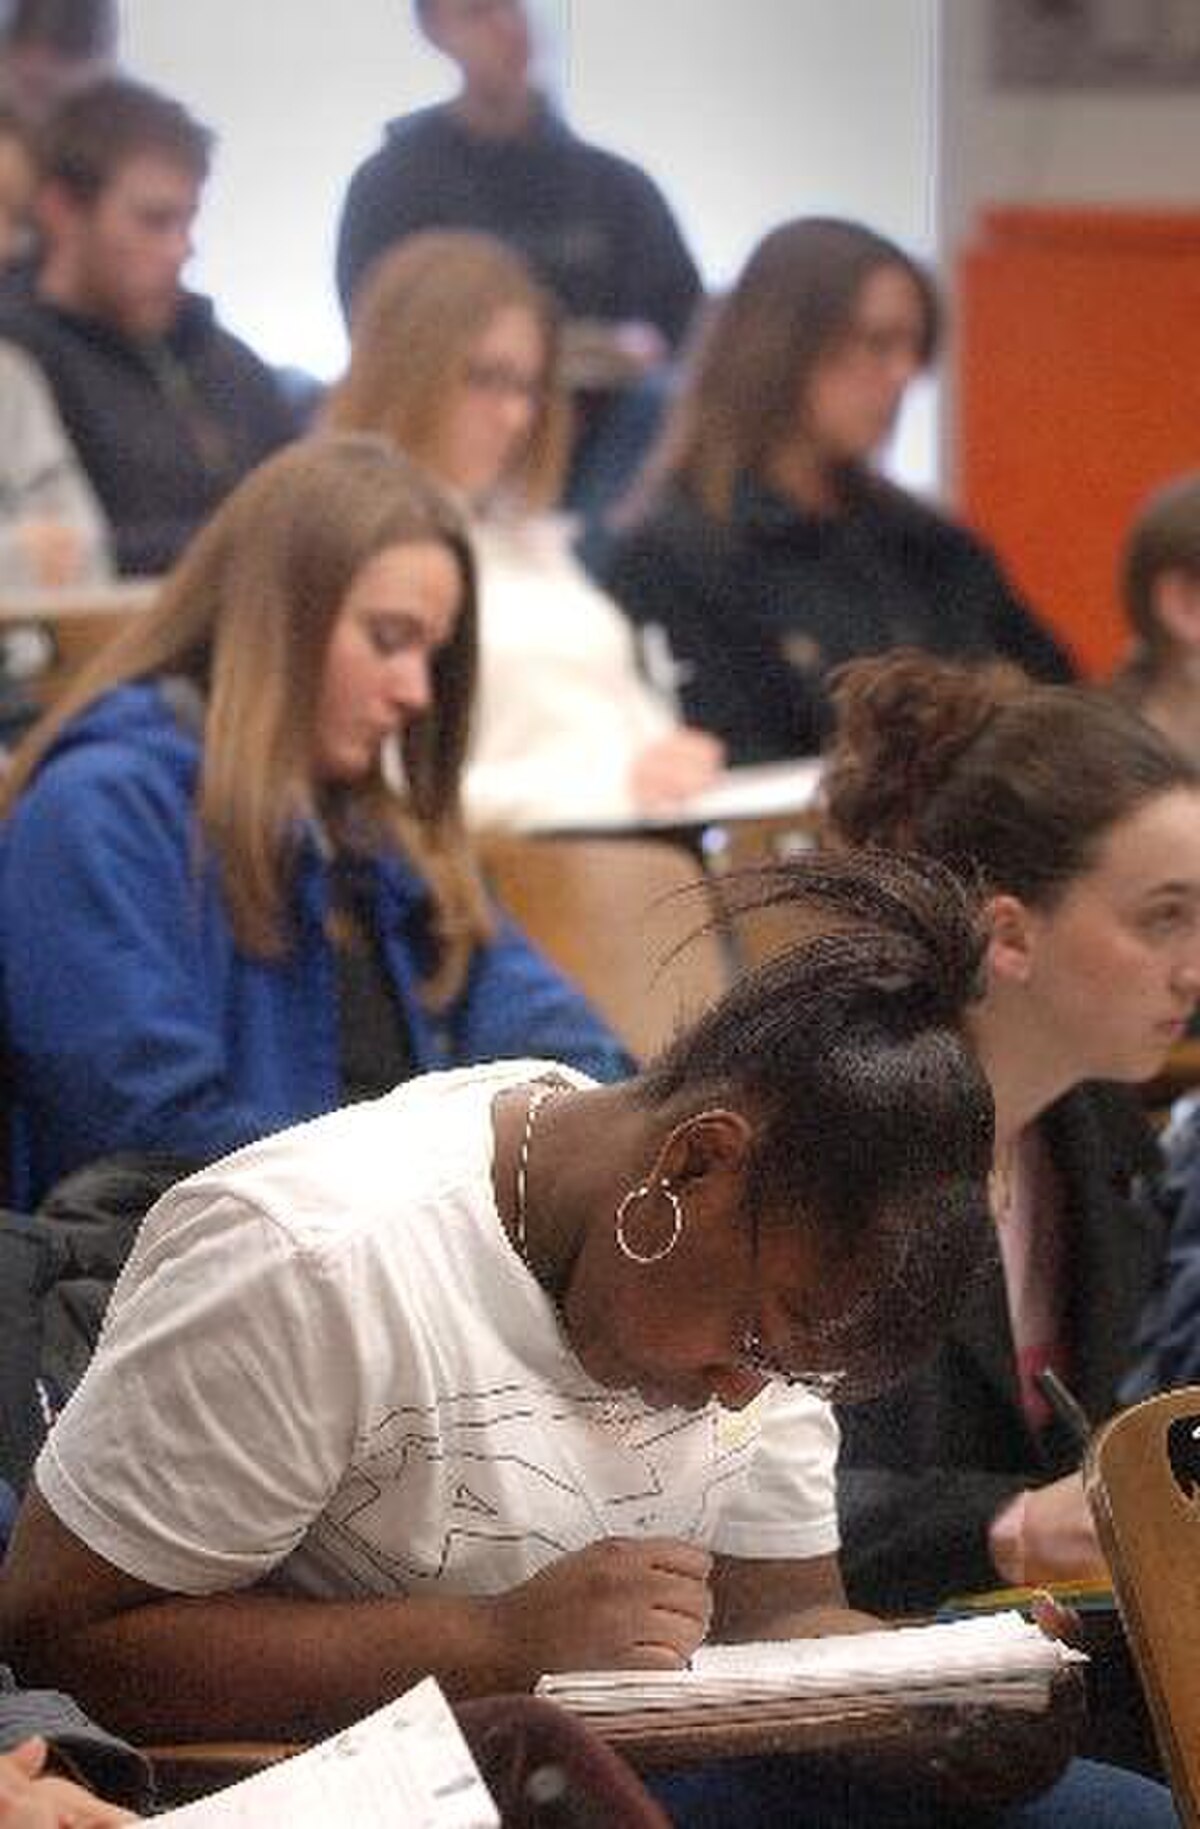
Students at the School of Veterinary Medicine at the University of Wisconsin–Madison are shown taking notes during a classroom lecture in June 2005. Tim1965, Public domain, via Wikimedia Commons
That shape has a name, the forgetting curve, and it was first measured by a man working alone on himself in the 1880s.
The man who counted his own forgetting
Hermann Ebbinghaus built 2,300 nonsense syllables, things like WID and ZOF, so that nothing he learned could lean on meaning. He began in 1879 and he was the only subject he ever used. He learned a list until he could say it perfectly. Then he waited, relearned the same list, and timed how much quicker the second time went.
An animated GIF of an analog stopwatch, showing the main hand moving from 0 to 5 seconds, with a smaller inner dial for minutes. Lookang, CC BY-SA 3.0, via Wikimedia Commons
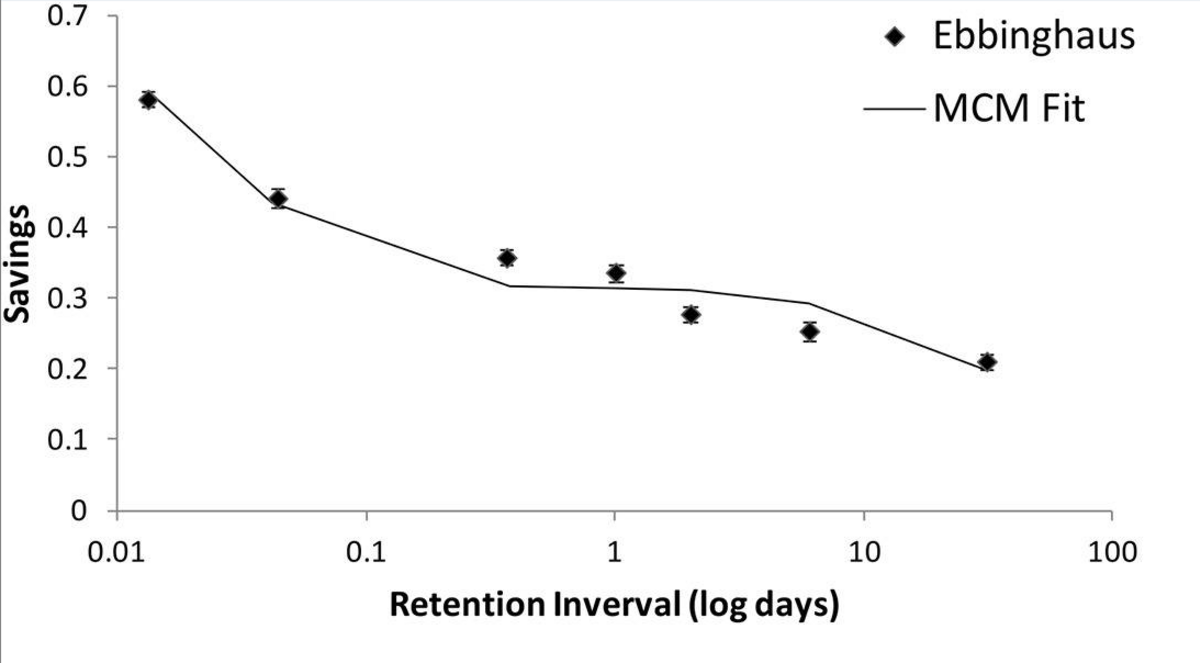
That saved time is the whole measure, and it is called savings. It is not a count of syllables he could produce; it is the share of the original work he no longer had to do. Twenty minutes after learning, his savings were 58 percent. A day later, 34 percent. A month later, 21. Most of the drop had happened on the first day.
What the curve does and does not say
Those numbers are one man learning strings of letters picked to mean nothing, scored by how fast he could relearn them. They are not a law about what you will keep from a lecture. The shape held up, though. A replication in 2015 put a single subject through seventy hours of the same procedure and came out with a curve close to his.
So the part worth carrying is the timing rather than the percentages. The loss is front-loaded, and it is largely done before you get around to worrying about it. Which changes what you should be checking. Not how much you had at the end of the session, but how much of it is still there the next day.
Graph illustrating the forgetting curve, plotting "Savings" on the Y-axis against "Retention Interval (log days)" on the X-axis. Jaap M. J. Murre, CC BY 4.0, via Wikimedia Commons
How Hermann Ebbinghaus measured forgetting
In the 1880s, German psychologist Hermann Ebbinghaus ran an extensive experiment on himself using 2,300 nonsense syllables: meaningless consonant-vowel-consonant combinations like WID and ZOF. By using artificial stimuli with no built-in meaning, he ensured his prior knowledge would not distort his measurements.
Ebbinghaus evaluated his memory through a metric called savings, which tracks the percentage of time saved when relearning a list compared to the first attempt. He found that twenty minutes after initial learning, his savings stood at 58 percent. After one day, savings fell to 34 percent, and after a full month, they leveled out at 21 percent. A 2015 replication using a single subject over seventy hours produced results closely matching his original curve.
How to flatten the forgetting curve
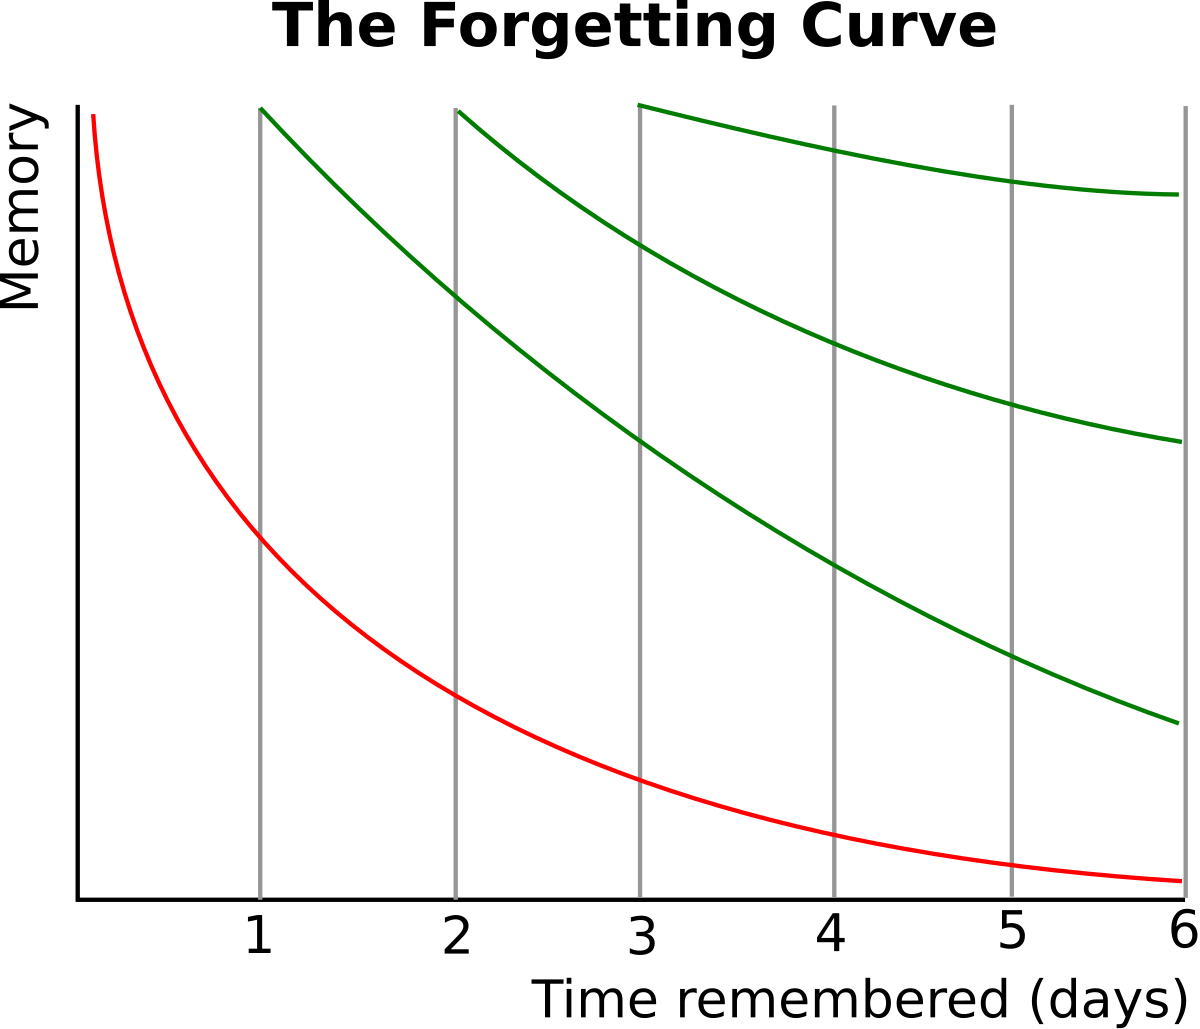
Each repetition based on active recall resets the curve and slows down the subsequent rate of forgetting. Ebbinghaus discovered that the curve flattens with every review session, allowing longer intervals between reviews over time.
Repeated reviews lift the retention line and widen the gap between necessary study sessions. The original uploader was Icez at English Wikipedia., Public domain, via Wikimedia Commons
The speed of forgetting also depends on physiological factors like sleep and stress, how meaningful the material is, and the depth of original learning. Reviewing material within the first 24 hours provides a strong defense against the initial steep drop, while other evidence suggests reviewing after 10 to 20 percent of the total time until the knowledge is needed.
Test yourself
How should a student use the forgetting curve to assess a lecture?
Check what they can still recall the next day.. Feeling that material made sense during the lecture does not show what remains. Checking recall the next day tests retention after the steepest early loss.
You learn something on Monday. When is your forgetting fastest?
In the first hours after the session. The curve is steep early and then flattens. Ebbinghaus's savings fell from 58 percent at twenty minutes to 34 percent at a day, then only to 21 percent by a month.
What did Ebbinghaus's savings score actually measure?
How much relearning time he saved. He relearned each list and timed it. Savings is the share of the original learning effort he no longer needed, not a count of what he could produce.
Play the lesson in edgi and the card is yours. It lands on your Map next to the ideas it connects to, and turns from matte to foil to gold as you learn more around it.
What type of memory failure does the forgetting curve describe?
It illustrates transience, which is the natural fading of memory traces across time. Transience is one of the categories identified in the framework of the seven sins of memory.
Do significant or shocking events follow the same curve?
Researchers debate whether highly significant events follow the standard curve. While some argue that shocking events form permanent flashbulb memories, studies comparing written recollections over years show that these memories still change as people incorporate later information.