US National Debt: why it was zero for only one year
The US national debt is the total amount of money the federal government has borrowed and not yet paid back, tracked through Treasury securities. It adds up every past yearly budget deficit where spending exceeded tax revenue. Except for a single year in the 1830s, the federal government has carried a national debt throughout its entire history.
By the edgi team We find the most surprising true thing about an idea and build a 60-second lesson around it.
The national debt is all the federal government's borrowing that has not yet been repaid. Think of a running balance, not the amount the government spent this year. The total is made of millions of separate debts with different payment dates. Some come due in weeks, others decades from now.
New borrowing raises the total. Repaying a debt without replacing it lowers the total.
Who the government owes
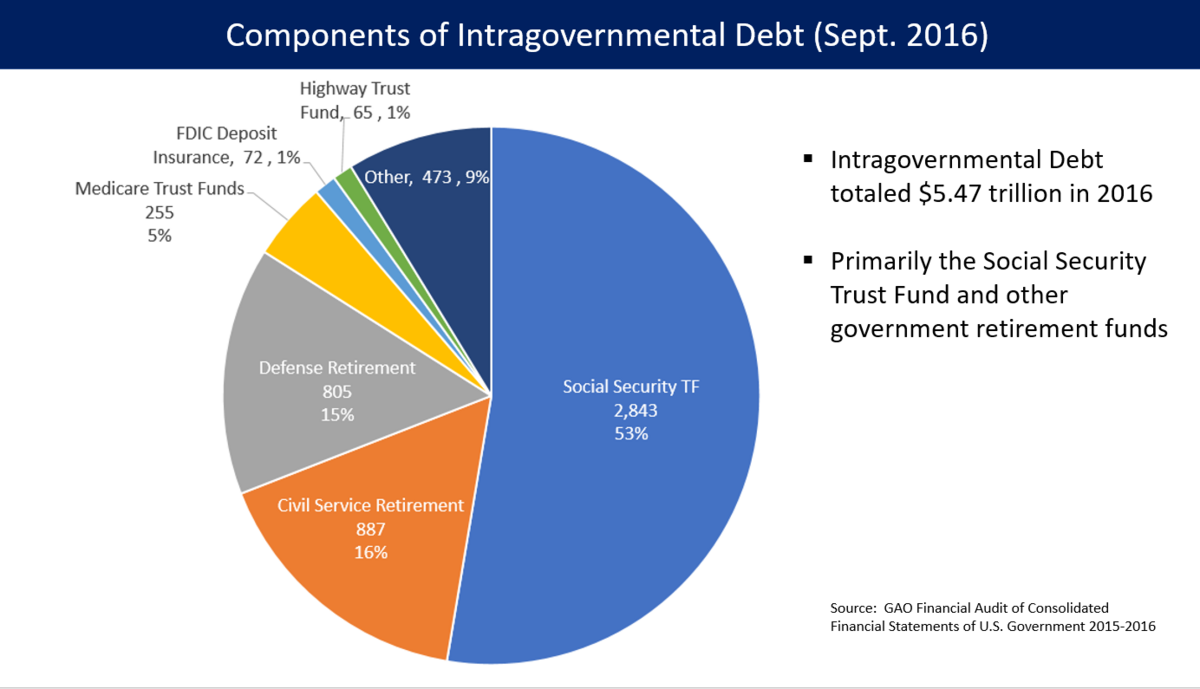
One category is debt held by the public. Despite the name, its owners include individual investors, banks, pension funds, foreign governments, and the Federal Reserve. The other category is intragovernmental debt. Social Security and other federal trust funds hold special Treasury securities for money set aside for future payments.
Both categories count toward the national debt. In one, Treasury owes investors and institutions; in the other, it owes money to accounts within the federal government.
Many promises, many due dates
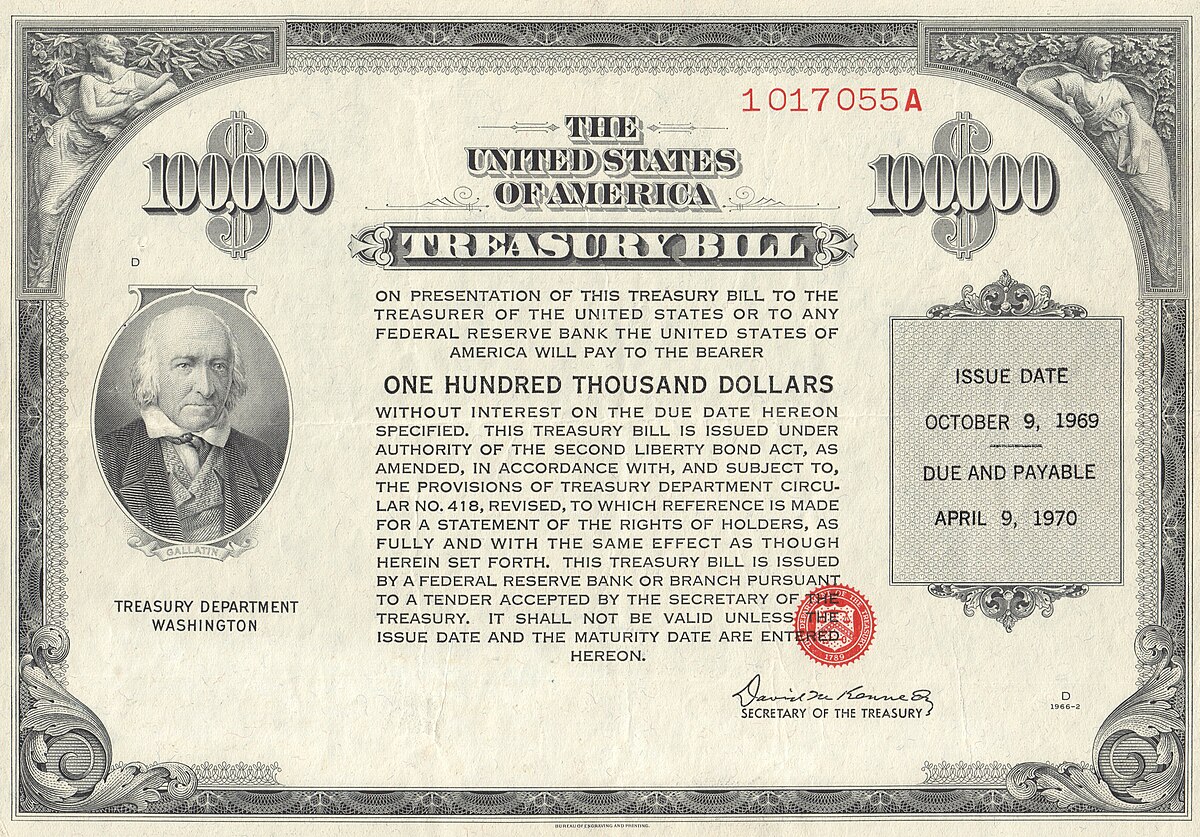
Most publicly held federal debt takes the form of Treasury securities. Each security has its own amount, interest terms, and maturity date. When one security matures, Treasury must have cash ready to repay it. Often Treasury raises that cash by issuing another security, alongside the borrowing needed for the current deficit.
No single date brings the whole national debt due. Treasury is always repaying some securities, selling others, and keeping track of what comes due next.
How does the federal government accumulate debt?
The federal government collects tax revenues to fund public services. When spending in a fiscal year outpaces tax receipts, the government runs a deficit and finances the difference by issuing Treasury securities.
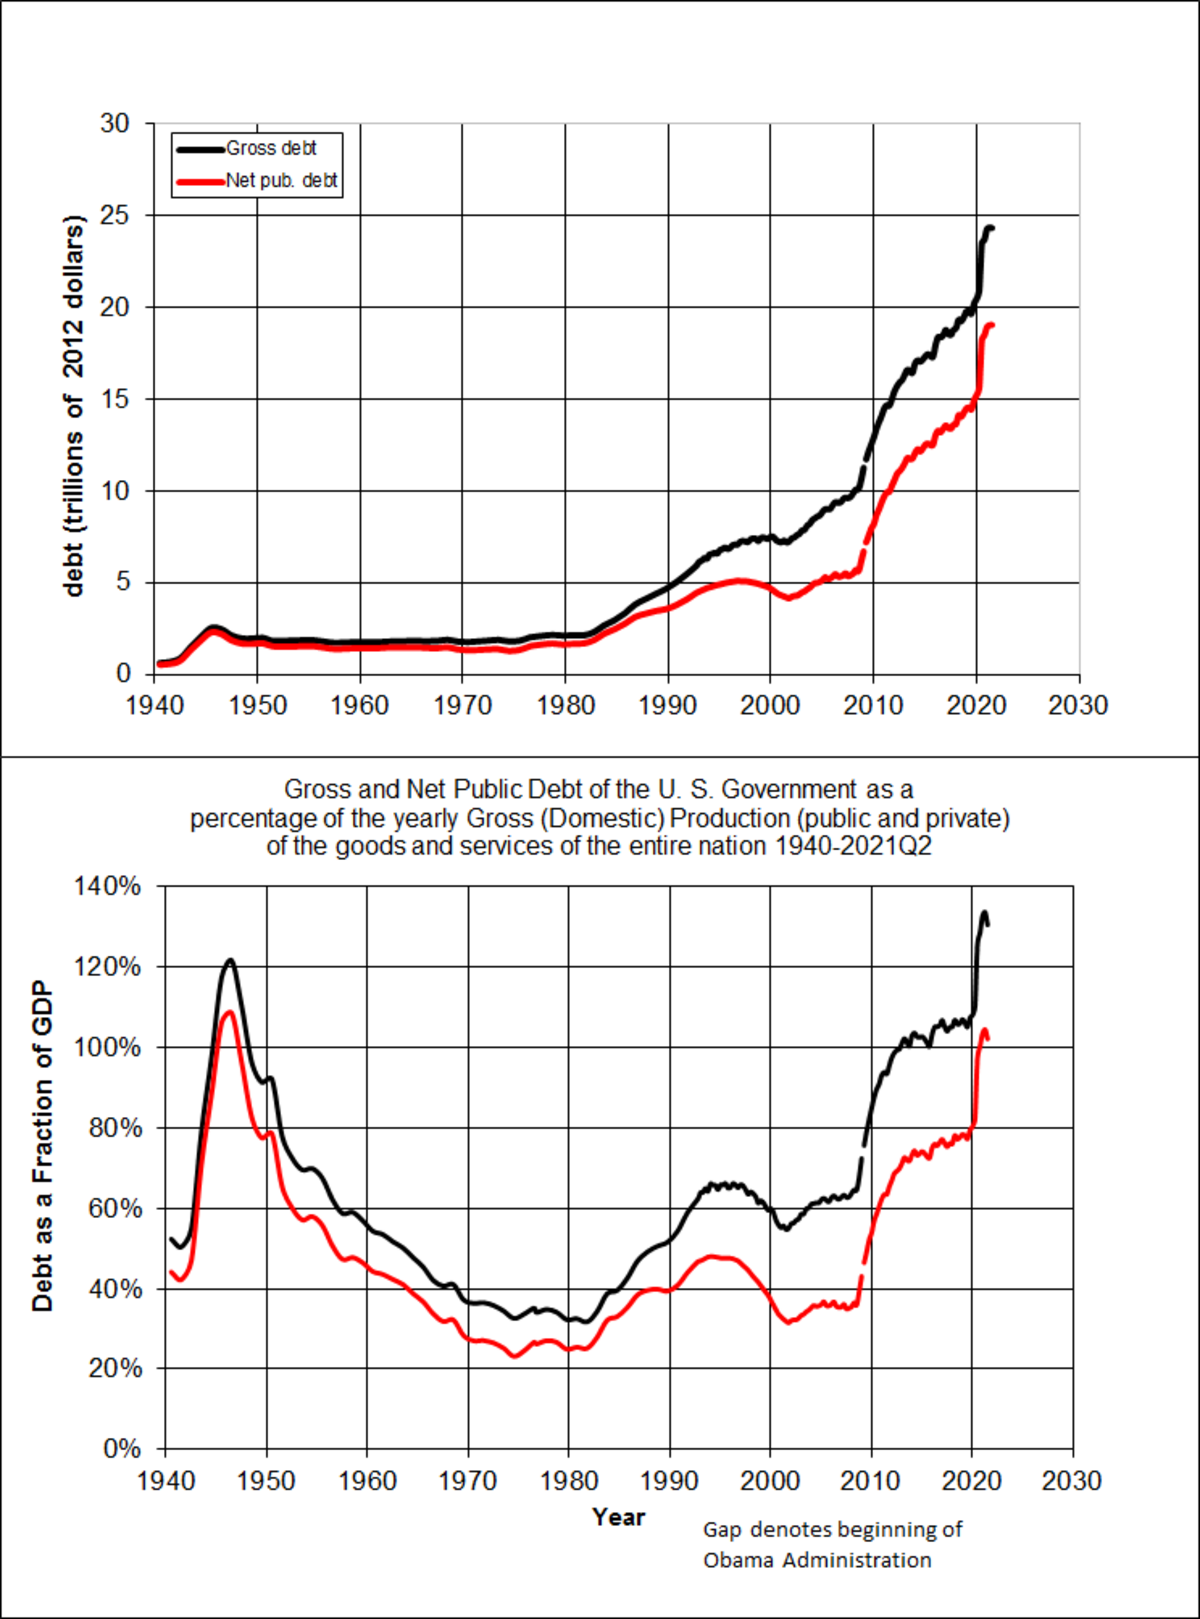
Tracking the split between debt held by the public and total gross debt highlights the running total the government owes over time. en:User:O18, CC BY-SA 3.0, via Wikimedia Commons
The national debt is the cumulative total of these past borrowing decisions, minus any repayments made during surplus years. It does not include unfunded future obligations. Congress sets an aggregate borrowing limit known as the debt ceiling, though the total national debt breached the 30 trillion dollar threshold for the first time in February 2022.
Historical swings in the debt-to-GDP ratio
The US completely paid off its national debt only once, between 1835 and 1836 under Andrew Jackson. Since then, the debt has fluctuated relative to the size of the economy, rising during armed conflicts, economic recessions, and pandemics.
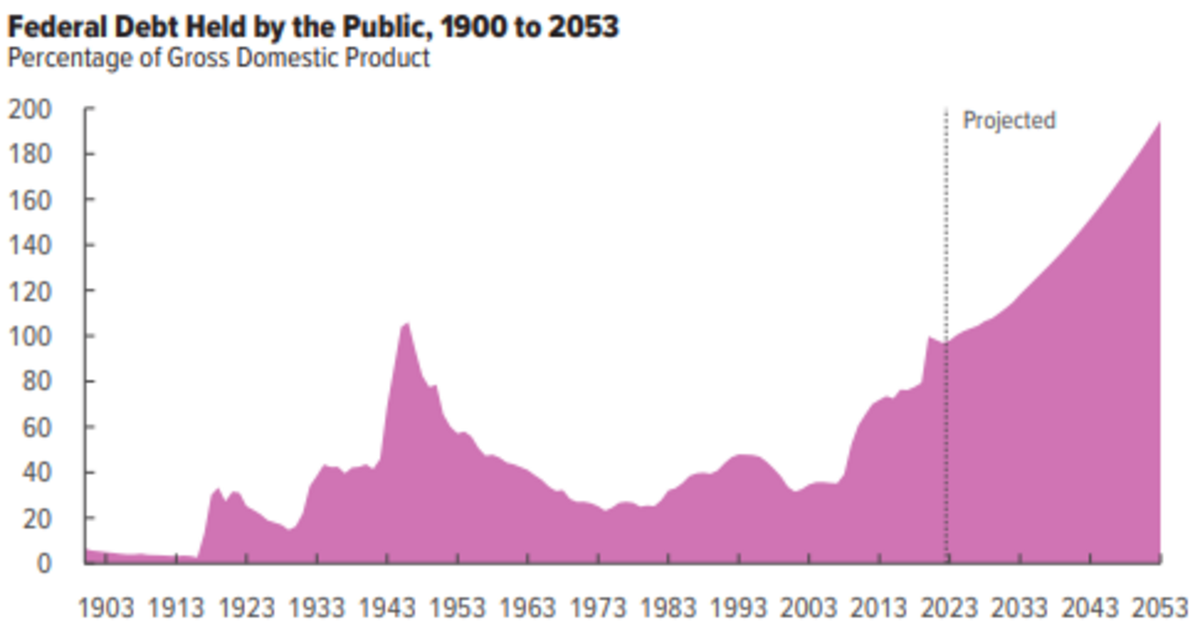
Tracking debt as a share of GDP shows major historical spikes during World War II, the 2008 financial crisis, and the COVID-19 pandemic. Congressional Budget Office, Public domain, via Wikimedia Commons
Public debt as a percentage of gross domestic product hit a peak during and immediately after World War II under Harry Truman, then dropped steadily to a low in 1974. Borrowing surged again in the 1980s under Ronald Reagan through tax rate cuts and higher military spending, fell during the 1990s economic boom, and spiked following the 2008 financial crisis and the COVID-19 pandemic.
During the pandemic, emergency aid and relief pushed the 2020 deficit to 16 percent of GDP, the highest level since 1945. The total national debt now exceeds total annual US economic output.
Test yourself
Is the national debt the same thing as this year's deficit?
No, it is all unrepaid federal borrowing. A deficit measures one period's gap between spending and receipts. The national debt is the running total of federal borrowing that has not been repaid.
Which holder creates intragovernmental debt?
A federal trust fund. Federal trust funds hold intragovernmental debt. Foreign governments and pension funds are among the investors who can hold debt held by the public.
Play the lesson in edgi and the card is yours. It lands on your Map next to the ideas it connects to, and turns from matte to foil to gold as you learn more around it.
As of December 2021, foreign private and governmental entities held 7.7 trillion dollars in Treasury securities. This accounted for approximately 33 percent of all debt held by the public.
Why is the debt projected to keep growing?
The Congressional Budget Office projects debt held by the public to reach 116 percent of GDP by 2034 and 172 percent by 2054. This increase is driven by interest costs and mandatory spending expanding faster than federal revenue and economic growth.