Yield curveWhy short-term rates can beat long ones
A yield curve is a line graph that compares the interest rates of bonds from the same issuer across different lengths of time. Usually, lending money for a decade pays a higher annual return than lending for a few months. When the line flips upside down, it shows that investors expect central banks to cut rates in the future.
By the edgi team We find the most surprising true thing about an idea and build a 60-second lesson around it.
The yield curve is a line that compares bond yields for different maturity dates at one moment. It shows short-term and long-term borrowing side by side. Yields on Treasury securities can be plotted for a three-month bill, a two-year note, and a ten-year note. Each point shows what investors demand to lend until that date.
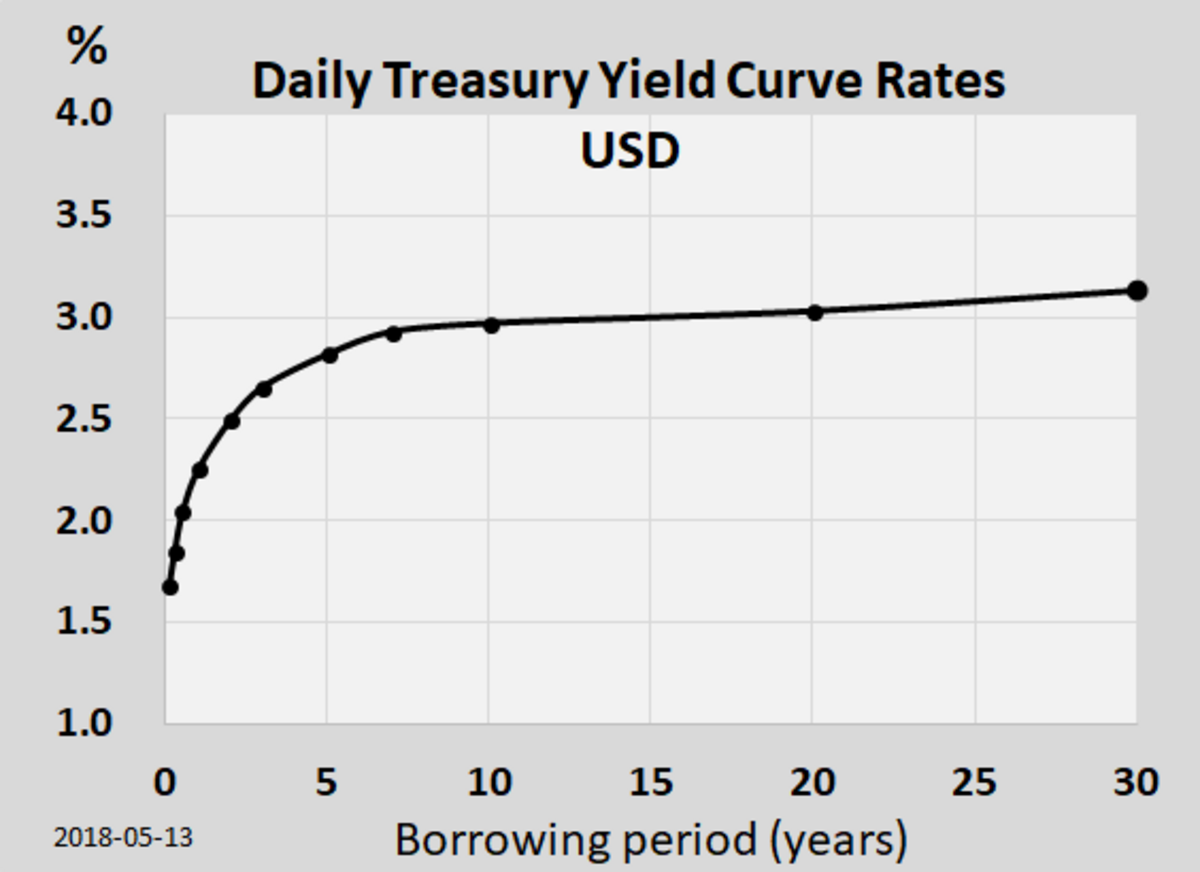
Graph titled "Daily Treasury Yield Curve Rates USD" showing the US Treasury yield curve as of May 13, 2018, with a typical upward sloping shape. Ldecola, CC BY-SA 4.0, via Wikimedia Commons
An upward curve has higher yields at longer maturities. A flat curve has similar yields, and an inverted curve has higher short-term yields.
Why the line has a shape
A longer-term yield partly reflects the average short-term rates investors expect in the years ahead. If they expect short rates to fall, long yields may sit below today's short yield. Long yields also include a term premium, extra compensation investors may want for holding interest-rate risk for longer.
Either part can move. The curve can change because investors revise their rate forecasts, demand different compensation for risk, or both.
What an inversion can signal
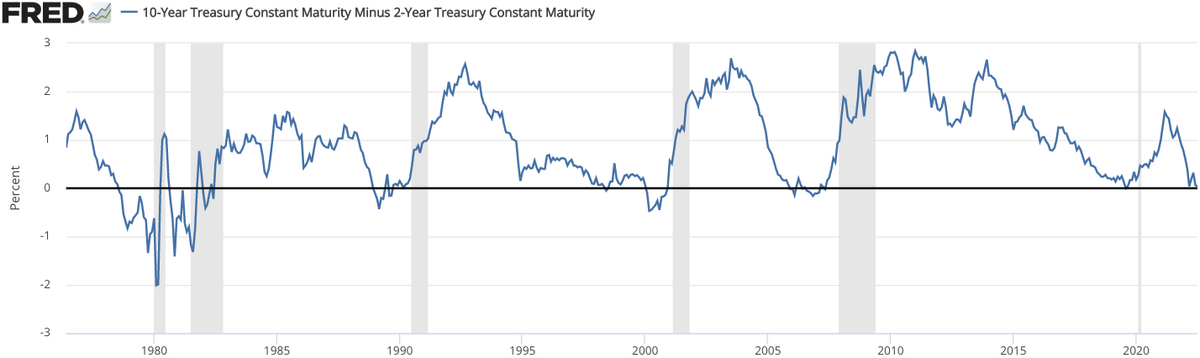
The U.S. yield curve has often inverted before recessions. That pattern can emerge when investors expect the Federal Reserve to cut short-term rates as the economy weakens.
Graph titled "10-Year Treasury Constant Maturity Minus 2-Year Treasury Constant Maturity" from FRED, showing the spread between 10-year and 2-year treasury yields from 1976 to 2022. FRED, Public domain, via Wikimedia Commons
An inversion is useful evidence about what markets expect, but it cannot tell you whether a recession will happen or give you a date.
Why does the curve change shape?
A typical yield curve slopes upward. Investors usually demand a higher return, called a term premium or risk premium, when locking up money for longer periods where uncertainty is higher. Long-term yields also incorporate what the market expects short-term rates to average over the coming years.
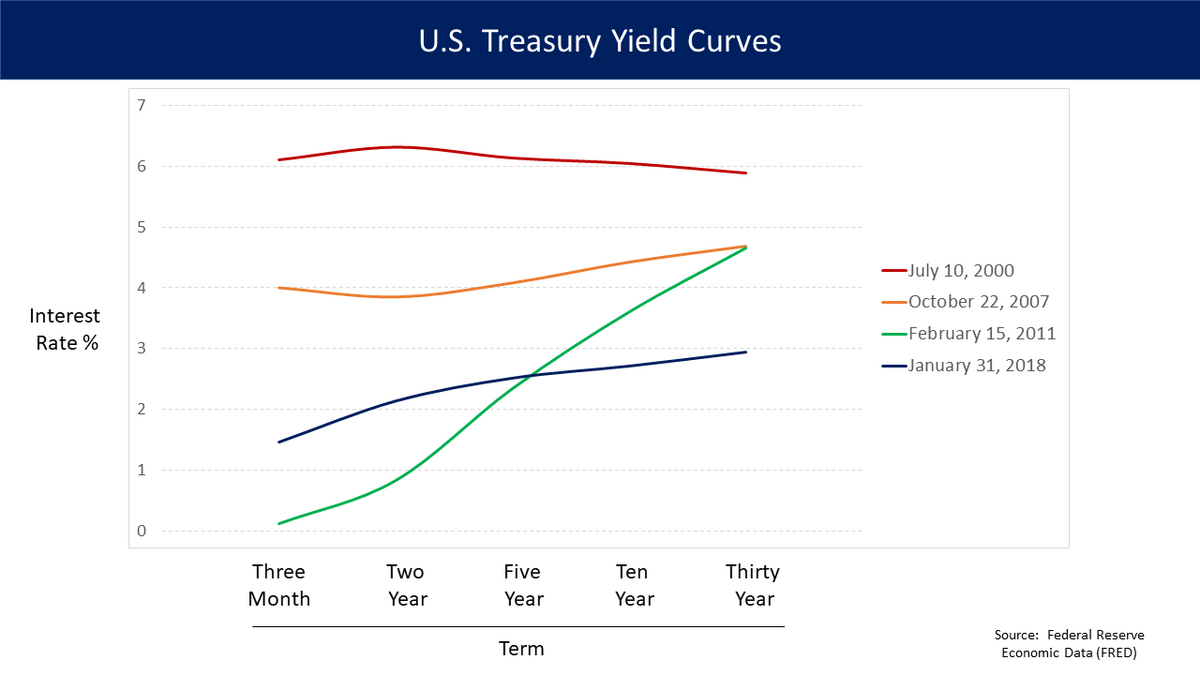
Compare the standard upward-sloping curve to the inverted red line from July 2000, where short-term borrowing costs exceeded long-term yields. Farcaster, CC BY-SA 4.0, via Wikimedia Commons
When investors anticipate that short-term interest rates will drop, long-term yields fall. If they drop below current short-term rates, the curve becomes inverted. Institutional supply and demand also shifts the line: if pension funds buy large amounts of long bonds to meet future obligations, long yields fall regardless of economic forecasts.
How do analysts track the curve?
Economists monitor the curve by calculating the term spread, which is the difference between two benchmark maturities. A common convention used by the Federal Reserve is the 10-year Treasury yield minus the 3-month Treasury bill rate, though the 10-year minus 2-year spread is also common.
Curves exist for various issuers and currencies. Government curves set a baseline for low-risk sovereign debt, while banks and corporations trade on swap curves and corporate bond curves. Corporate yields sit higher than government bonds to account for credit risk, adding a credit spread on top of benchmark rates.
Test yourself
Does a normal yield curve feature higher yields at longer maturities?
Yes, investors demand more for long risk. A normal upward-sloping yield curve offers higher yields on long-term debt to compensate investors for tying up capital and taking on interest-rate risk over time.
What does an inverted yield curve typically imply about future interest rates?
Investors expect short-term rates to fall. An inversion often occurs when markets expect the central bank to cut short-term rates in the future, driving long-term yields below current short-term yields.
What does a yield curve compare?
Bond yields across different maturities. A yield curve lines up rates for debt that comes due at different times, from short maturities to long ones.
Play the lesson in edgi and the card is yours. It lands on your Map next to the ideas it connects to, and turns from matte to foil to gold as you learn more around it.
A parallel shift happens when interest rates across every maturity rise or fall by the same amount. The entire curve moves upward or downward on the chart without changing its overall slope.
Has the yield curve always sloped upward?
No. Through much of the 19th and early 20th centuries, the U.S. economy experienced persistent deflation, which caused the yield curve to spend long periods inverted.
What is a corporate credit spread?
A corporate credit spread is the extra interest rate a company pays above a baseline rate, such as a swap curve. It compensates lenders for the risk that the company might default.